
Know whether it's actually coming back.
Drone and airborne deep learning for recovery monitoring — seismic lines, well sites, pipelines and any other disturbance. Conifer and deciduous alike, counted from 20 cm up.
THE CHALLENGE
You need to prove your site is recovering. Current methods can't keep up.
Helicopter sketch-mapping gives you broad estimates but misses individual trees. Field plots sample a fraction of a percent of your site. Neither gives you a defensible, wall-to-wall picture of what's actually growing back — and how fast.
Regulators want evidence. Your reclamation timeline depends on it. You need spatial data that covers the entire disturbance, counts every seedling, and holds up to scrutiny.
What drones changes for you
Field surveys are accurate at the point level — but they can't give you the full spatial picture, and every site visit carries risk.
Know the state of your sites before committing field crews. Prioritize where to send people and where the data already speaks for itself, and save the field budget for where it changes a decision.
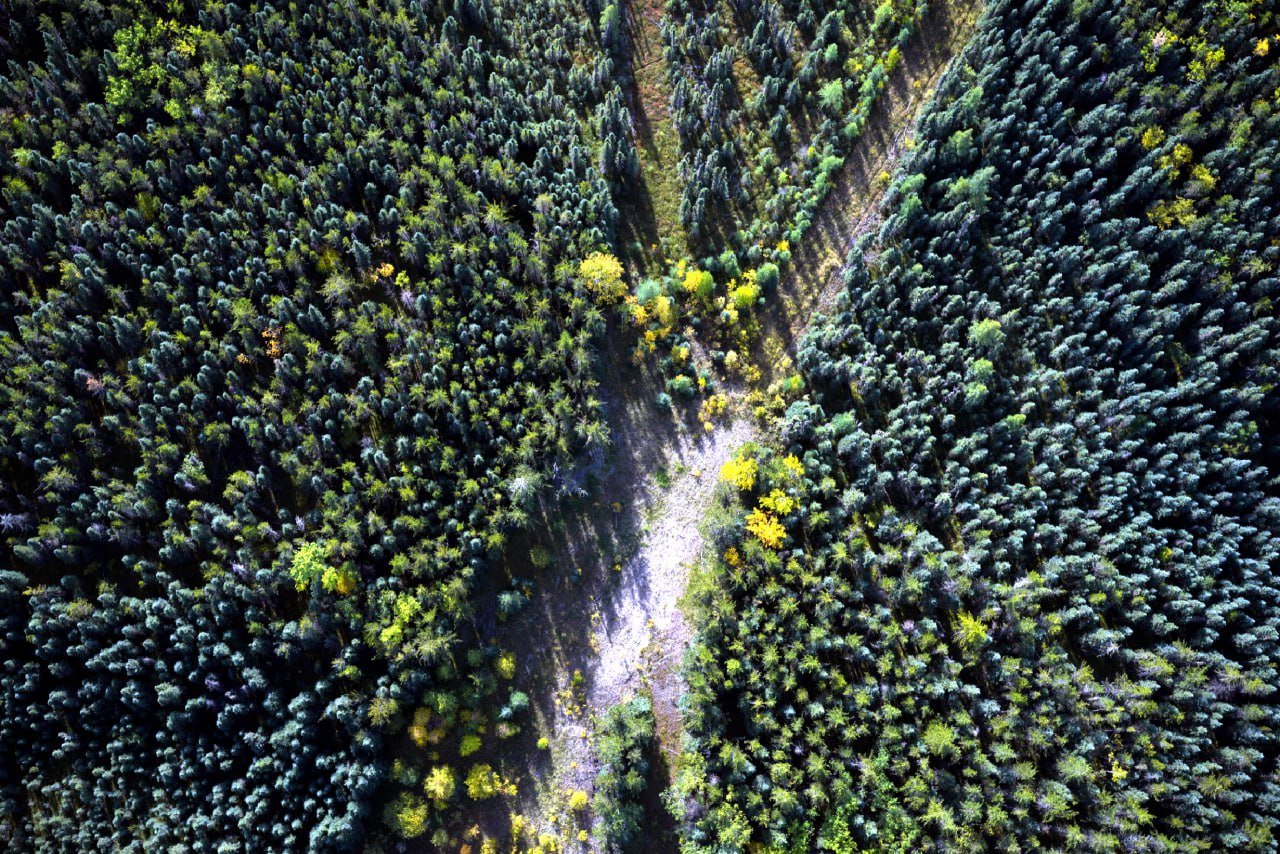
Deep learning models count individual conifer seedlings and deciduous trees across the entire disturbance. Not a sample — the full footprint, with every stem located.
Consistent methodology, consistent results. Fly the same site year after year and show quantifiable progress — the kind of spatial evidence a reclamation application can be built on.
ASSESS TRAJECTORY
Track recovery year over year.
Re-fly the same site with consistent parameters. Multi-temporal change detection shows whether each area is moving toward closure — or stalling.
A first flight settles what the site looked like on a given date, at full coverage. Everything after it is measured against that record rather than argued from memory or from whichever plots happened to be walked.
Sites that are clearly coming along don't need the same field effort every cycle. Fly them, see how far they have got, and spend the crew time on the sites carrying flags instead of the ones quietly doing what they should.
Density, cover and species presence reported on the metrics your framework already uses — so the record drops into the package your QRS is assembling rather than sitting beside it as one more file to reconcile.
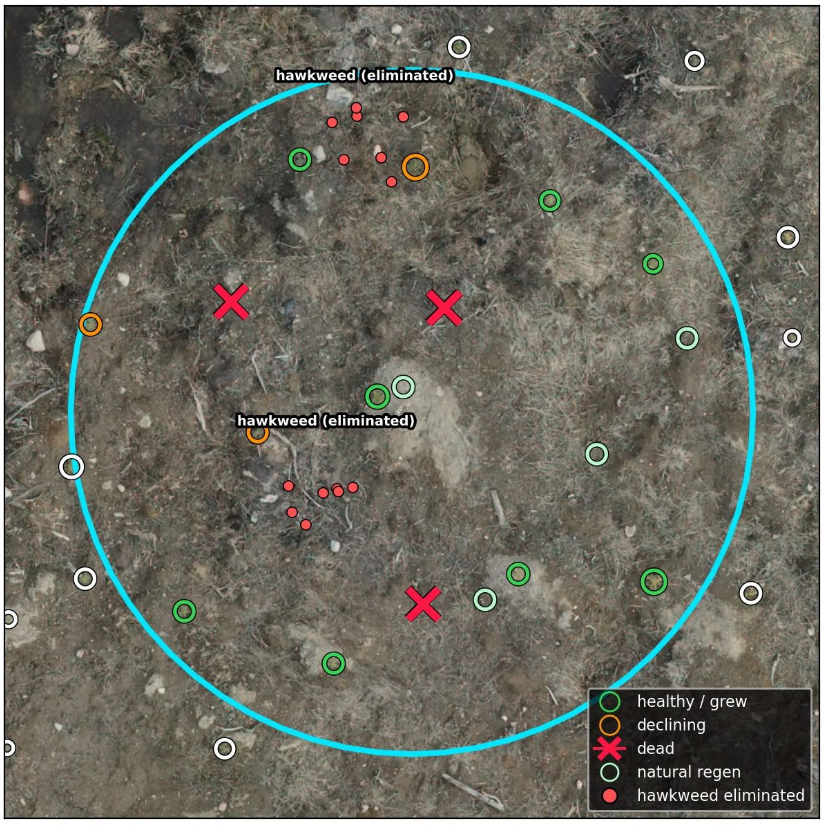
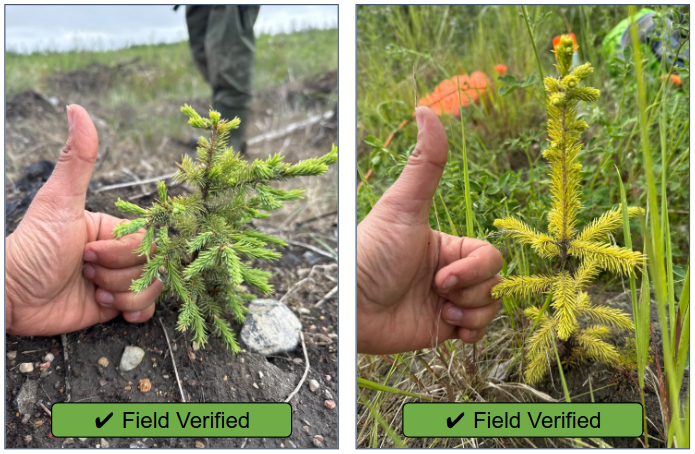
FIELD VALIDATED
Every stem counted, not estimated.
Seedlings from drone imagery, larger stems from airborne. Conifer and deciduous, each one located individually.
The whole site, not plots. Counts roll up to the ESSG 800 stems/ha threshold automatically.
Hundreds of thousands to millions of stems in a single campaign. Counting is no longer the constraint.
In good conditions we find about 90% of 20 cm conifers. Dense competing vegetation, smaller stems and poor light pull that down.
How it works
Phase 1
We fly your sites
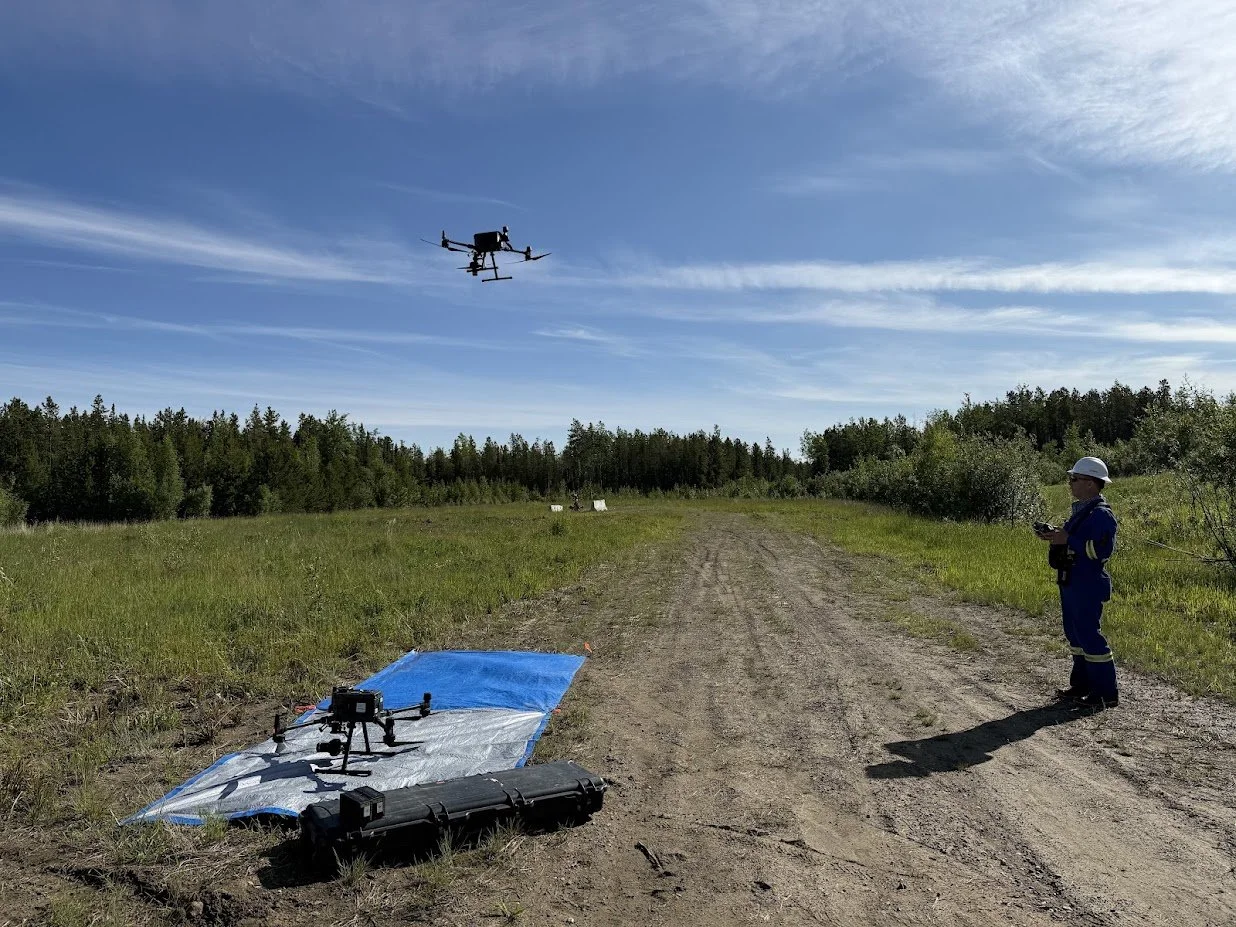
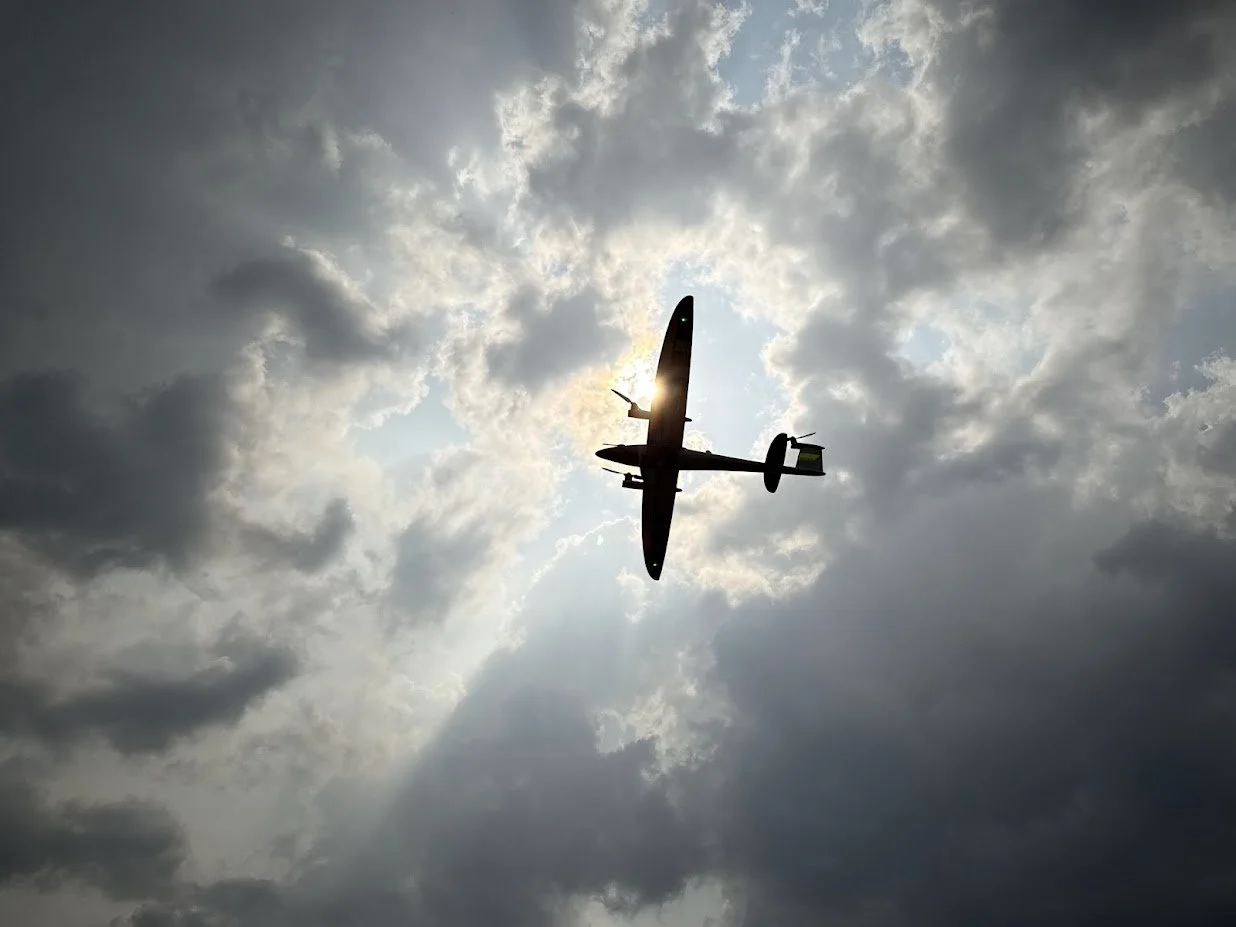
Fixed-wing or multirotor drone flights capture sub-centimetre imagery across your seismic lines, well sites, roads, or pipelines. Large-area operations use beyond-visual-line-of-sight (BVLOS) flights to cover hundreds of hectares efficiently.
Phase 2
Deep learning processes every pixel
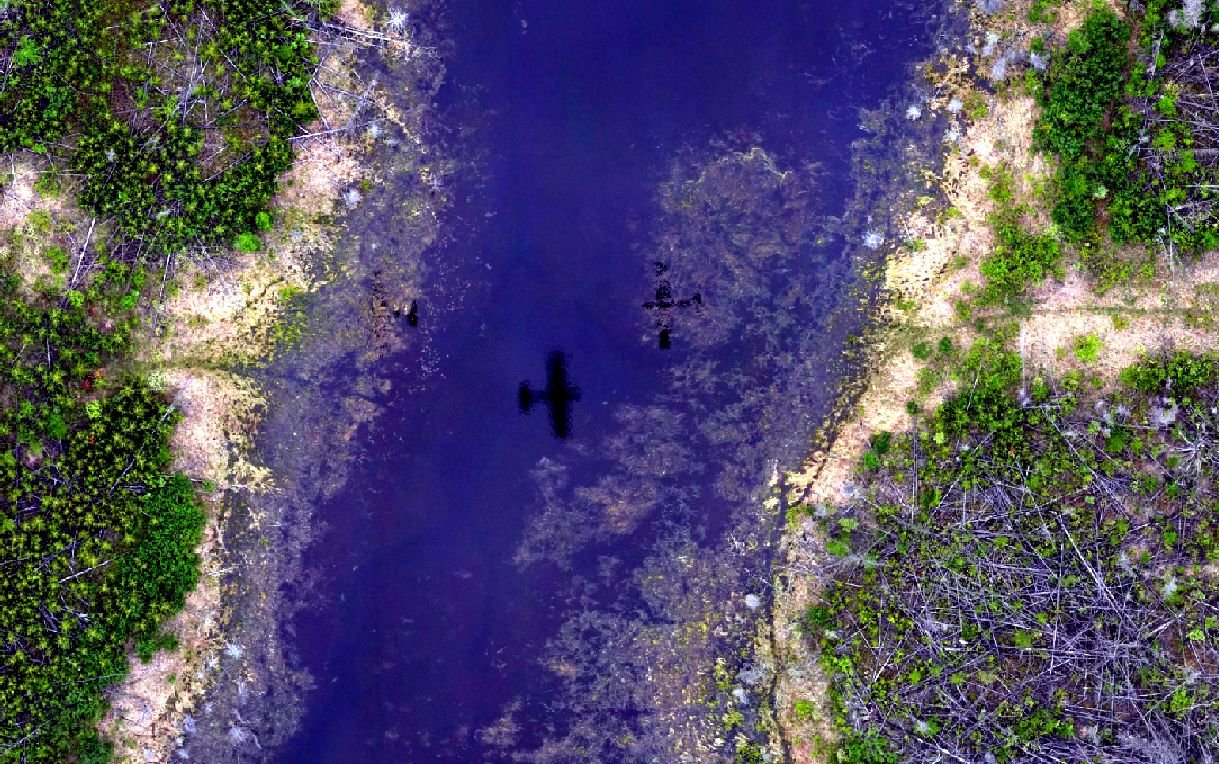
Our AI models — trained on a decade of boreal ecosystem data — detect and count individual seedlings, classify ground cover, map water features, and identify bare earth across the entire disturbance footprint.
Phase 3
You get actionable maps and data
GIS-ready spatial products showing recovery status for every metre of your site. Seedling density maps, cover classification, fragmentation analysis, and an integrated recovery assessment — ready for regulatory submission or internal planning.
What We Deliver
Individual conifer and deciduous tree counts, from the NeedleNet and LeaveNet models. Each stem located, not estimated as cover.
Total canopy coverage classified across the full disturbance footprint, so cover is a measured figure rather than an impression.
All indicators combined into a site-level recovery rating — the single answer the rest of the deliverable has to support.
Find out what's actually out there.
Ten-minute call, no cost. Tell us the ground and the species, and we'll tell you honestly whether flying it would show you something you don't already know.