
Every sensor, and the models to read them.
Ten years flying for research — LiDAR, multispectral and sub-centimetre imagery, with deep learning behind it. We plan the capture around what you need to know, because when and how a site is flown decides what the data can answer.
Everything in frame is measurable.
A decision-grade survey hands you a measured surface rather than a handful of certified points. Anything inside it can be measured afterwards — including the thing you didn't know you needed when you booked the flight, which is most of the value and the part nobody quotes for.
It is current, it covers all of the subject rather than the parts someone chose to visit, and it is cheap enough to repeat. That last one matters more than it sounds: questions like how much is in the pile, how far has it spread, how much has recovered and what changed since last year come back every season, and a grade of data you can afford to fly again is the only kind that answers them.
Planimetric accuracy is within 10 cm, and resolution goes down to 2 mm on RGB — which for most questions is the number that decides the job. Enough to decide, plan, prioritise and document.
The tier above is a legal survey: where a boundary sits, to a standard that holds up in a land title office. That is an Alberta Land Surveyor's work, and when you need it there is no substitute — we will tell you when you have reached that point, and hand over what we captured.
The data, and the answer pulled out of it.
A flight produces pixels and points. What you actually need is the thing those pixels tell you, extracted and measured. Both arrive.
Georeferenced imagery of the whole subject, seamless and measurable, at resolutions down to 2 mm. Zoom in anywhere; measure anything.
Bare earth and full surface, contours, slope and drainage paths. From LiDAR where the ground sits under cover, from photogrammetry where it doesn't.
Dense classified point cloud, and a 3D model where the subject has structure worth seeing from more than straight down.
Objects found and located individually rather than estimated — stems, patches, assets, anything a model can be trained to recognise.
Every metre labelled: cover type, condition, material, disturbance. The map stops being a picture and becomes a layer you can query.
Cubic metres against a surface or a previous flight, and difference between dates — what moved, what grew, what appeared, and by how much.
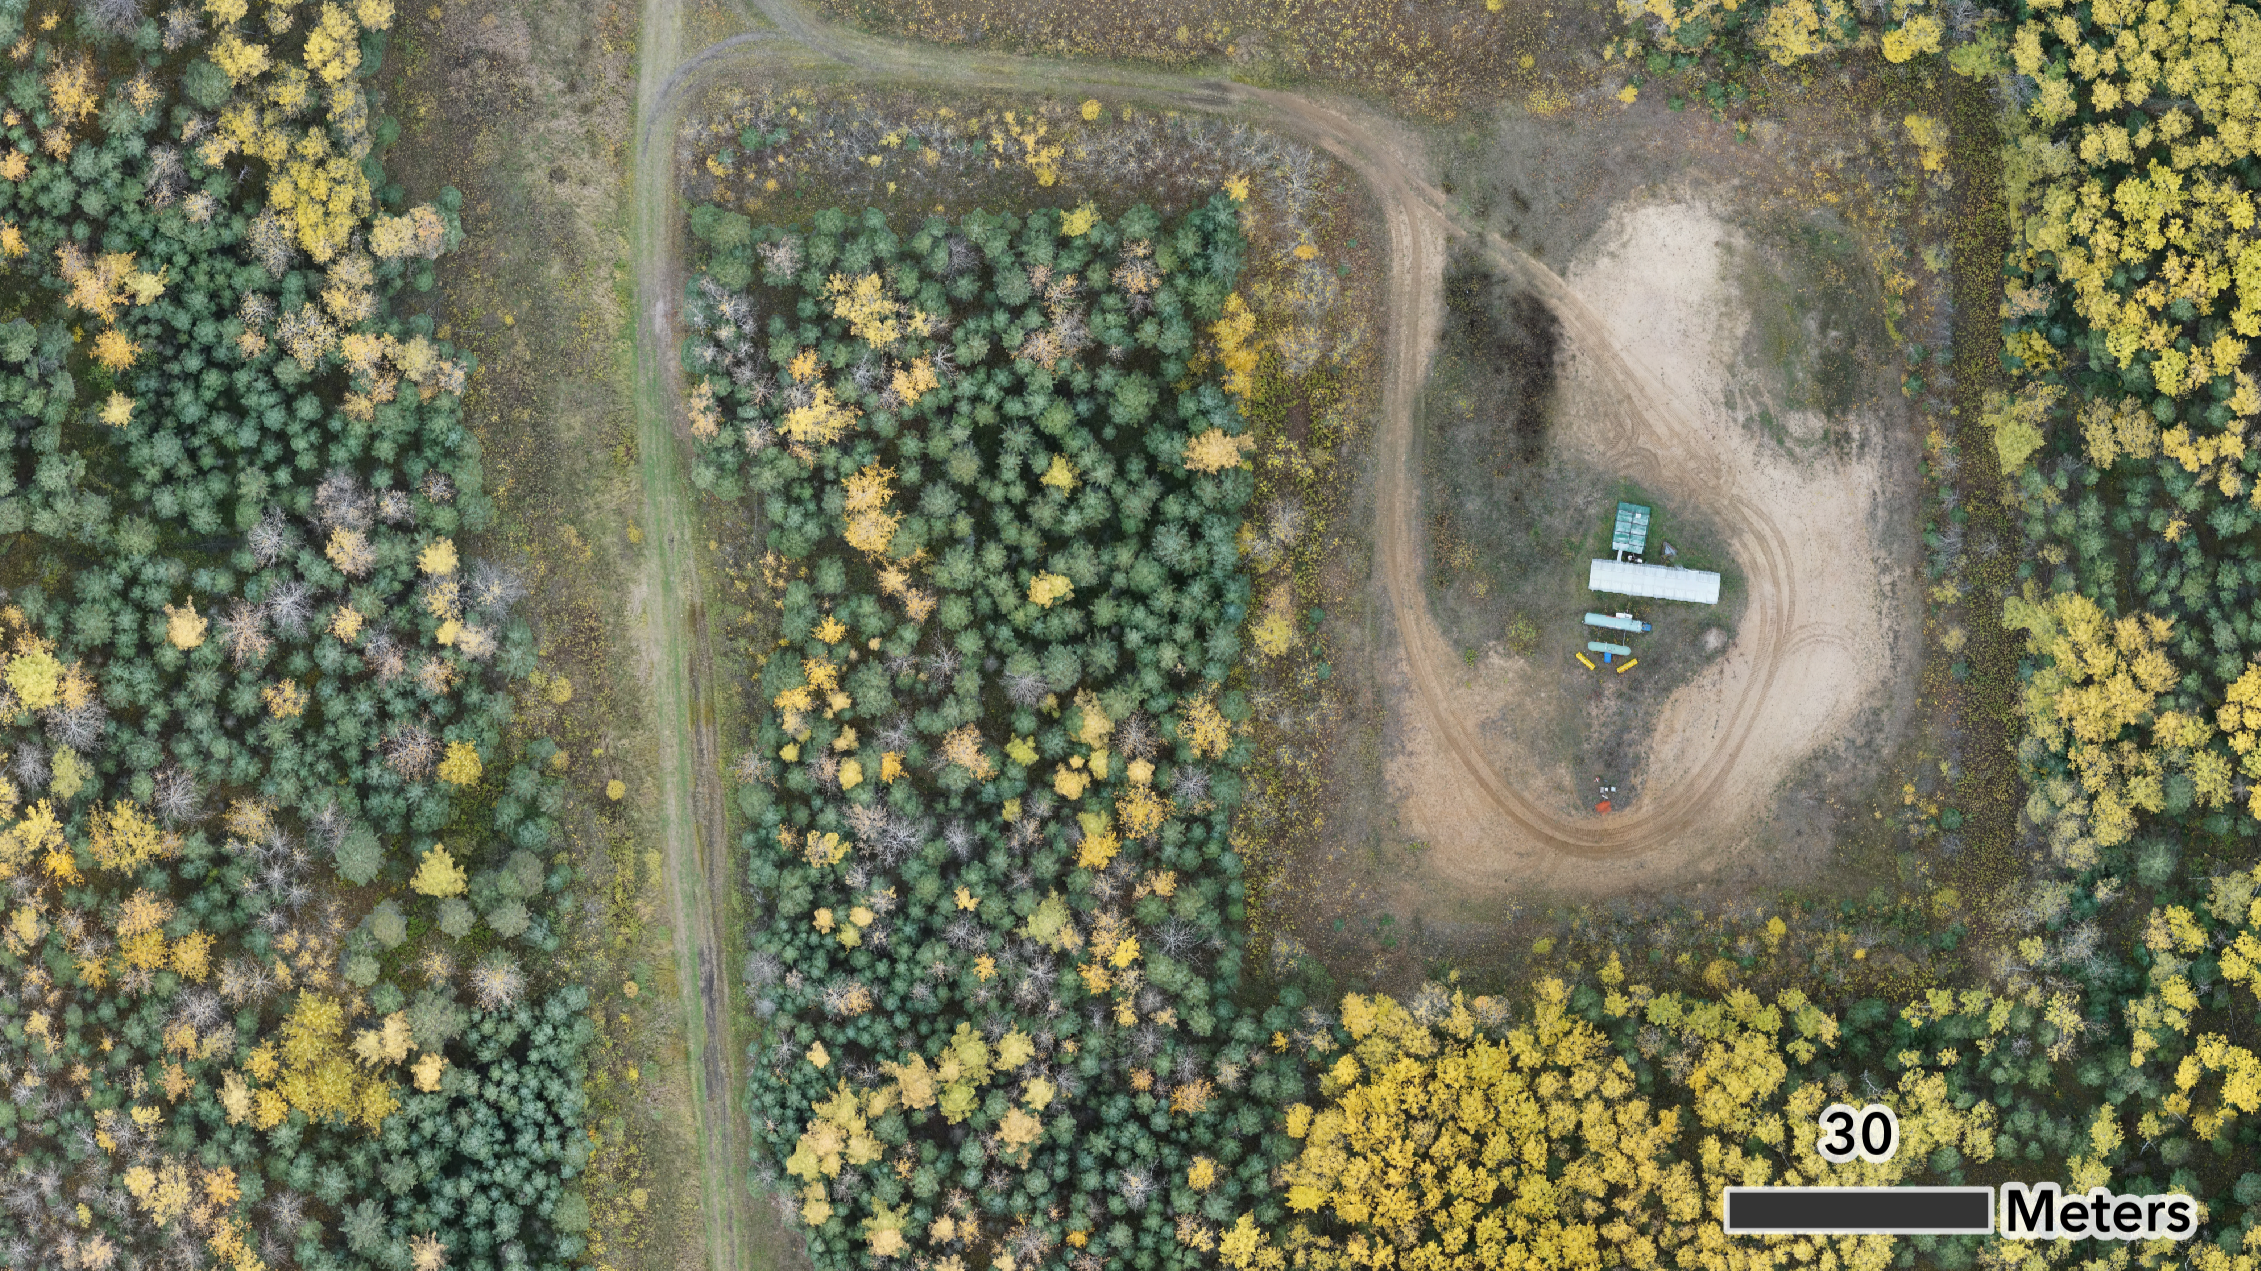
The subject changes. The method doesn't.
The same capture and the same processing chain, pointed at whatever needs measuring. These are the places it goes most often — not a closed list.
| Sector | Typically |
|---|---|
| Energy and industrial | Lease and right-of-way condition, reclamation status, disturbance footprint, stockpiles, site records before and after work. |
| Environment and reclamation | Vegetation recovery, invasive species, wetland-adjacent condition, erosion, change over successive seasons. |
| Municipal and public land | Road allowances, parcels and public spaces, asset condition, complaints that need a dated record. |
| Construction and aggregate | Progress records, terrain before design, cut and fill, stockpile volumes tracked month to month. |
| Agriculture and rural land | Drainage and wet ground, field condition, terrain, tree and shelterbelt inventory. |
| Research and monitoring | Repeat capture on a defined protocol, where consistency between dates matters more than any single flight. |
The processing is the part that took ten years.
Our detection and classification models came out of a decade of boreal ecosystem research at the University of Calgary, and they are still being extended — where a job needs a model that doesn't exist yet, building it is a normal part of the work rather than a reason to say no.
That is why a deliverable arrives with the count already done, the cover already classified and the difference from the last flight already measured. It is also why we are particular about capture: resolution, lighting and the point in the season a site is flown all decide what can be pulled out of the data afterwards, and none of them can be fixed in processing.
Delivery: either through Geoglyph, our browser viewer — nothing to install, and a link you can pass to whoever needs to see it — or as a plain package of files with a written report. Plenty of clients take both.
Two numbers, and they answer different questions.
These get used interchangeably and they are not the same thing. Planimetric accuracy is how correctly something is positioned — ours is within 10 cm. Resolution is how small something can be and still be visible at all — ours goes down to 2 mm on RGB.
For most of what we are asked, resolution is the one that decides whether the flight was worth taking. At 2 mm you can pick a caterpillar off a leaf, or read the lettering on a chip bag somebody dropped in the ditch. You do not need survey tolerance to count seedlings or find a patch of weeds — you need to be able to see them.
Ten centimetres is ample for measuring an offset, a ponding area, a stockpile or a footprint, and it is not a boundary determination or a payment quantity. Where a job needs tighter positioning than that, say so early and we will tell you honestly whether it is within reach or whether you want the tier above.

A fixed price before we fly.
A quote comes back within one business day of hearing from you, and a scoped proposal within a week. Deliverables follow two to three weeks after the flight — sooner where a job only needs imagery and terrain, longer where it needs models run over the whole area.
Priced by area and access, with a minimum on small jobs because getting there is most of the cost. The per-hectare rate falls sharply with size, and again on repeat or multi-site programmes where we are already set up for the ground.
| Job | Typically | Notes |
|---|---|---|
| Single small site up to about 25 ha | $1,500–$3,000 | Mobilisation dominates at this size, so the minimum applies. One flight, full deliverable set. |
| Typical site or lease 25–150 ha | $3,000–$8,000 | Where most single-site work lands. Cost per hectare roughly halves across this band. |
| Programme or large area 150 ha to tens of km² | Per hectare, quoted | Multi-site and repeat work comes down substantially. Airborne carries the area where drone time stops making sense. |
Before you call.
Is this a legal survey?
No, and it isn't trying to be. If you need a boundary established or a Real Property Report, you need an Alberta Land Surveyor. What we do is show you the site accurately enough to decide whether you're at that point.
How accurate is "accurate enough"?
Positioned within 10 cm, and resolved down to 2 mm. In practice: enough to tell a two-metre encroachment from a ten-metre one, to measure a pond to within a few percent, or to count seedlings a few centimetres tall. Not enough to place a property pin or settle a payment quantity.
Can you fly in winter?
Often winter is the better time. With the leaves off and the ground bare, terrain, encroachment and anything sitting on the surface read far more clearly than they do under midsummer canopy, and LiDAR carries its own light source so low sun is not the problem it is for photogrammetry. The real limits are deep snow, which hides what you are trying to see, and hard cold, which shortens flight time. Chinook windows are workable. Tell us the target and we will say whether waiting for spring buys you anything.
How small a job is worth flying?
There is no size too small to fly — there is a size below which you are mostly paying for the drive. Because mobilisation dominates on small jobs, anything under roughly 25 ha is priced against a minimum rather than by area. If you have several small sites in one area, book them together and that problem disappears.
What if I need a real survey after all?
Then you will know that before you have spent much, and we will pass on what we captured so none of it is wasted. Survey firms work from our imagery and terrain routinely — it narrows down where they need to put their time.
Can you map something that isn't land?
Usually, yes. Structures, stockpiles, corridors and infrastructure are all fair game — the question is whether what you care about is visible from above and at what resolution, which is a five-minute conversation rather than a quote.
Find out what's actually out there.
Ten-minute call, no cost. Tell us what needs measuring.